by Laura Haldane | Dec 1, 2025 | Reports
Here’s our monthly look at the NIH funding data. The US government shutdown only ended on November 12th, with most workers returning on the 13th, but we can see that November is always a bit quiet anyway. Overall YTD 2025 stands at $37bn – a $1bn (3.3%)...
by Laura Haldane | Nov 4, 2025 | Reports
As promised, here are the updated NIH graphs with the October data. The US government shutdown meant there was actually ZERO funding awarded in October, but it is always a quiet month as we can see in previous year’s data below. Year-to-date we are only 2.5%...
by Laura Haldane | Oct 8, 2025 | Reports
As promised, here are the updated NIH graphs with the September data! Continuing on the trend of the last few months, September was another big month which has clawed back a lot of the deficit from earlier in the year so we’re now only 1.5% behind where we were...
by Laura Haldane | Sep 12, 2025 | Reports
A lot of people have been asking us about the latest NIH funding data, so we figured we’d put together some graphs to show the trends and how it’s actually shaping up. The short answer is the last few months have been on the up, recouping some of the losses from...
by Rachel Lively | Jan 29, 2024 | Reports
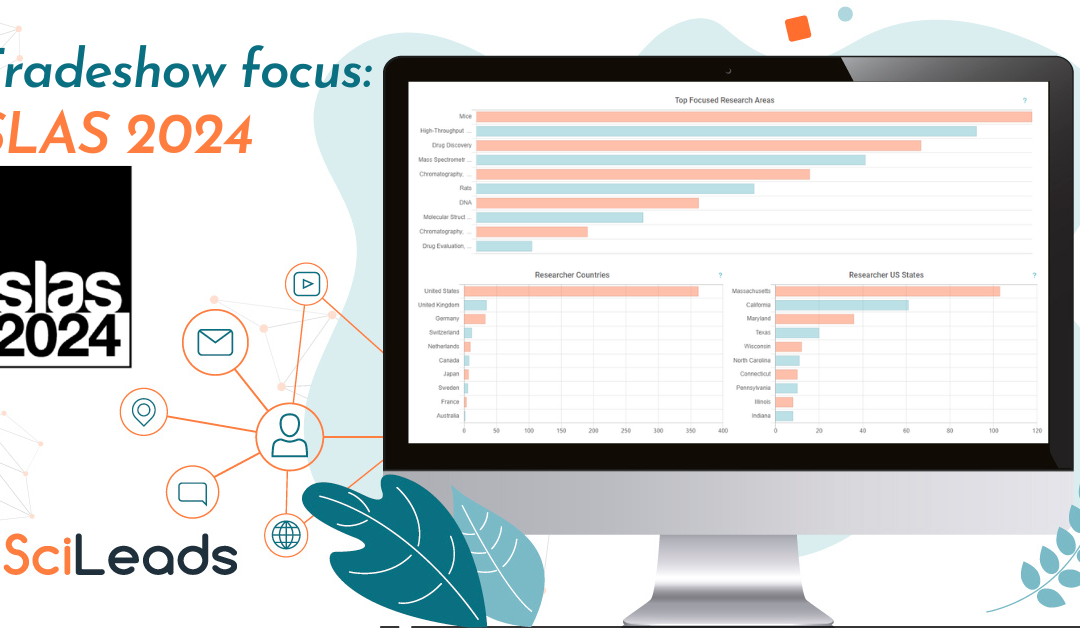
We’ve used our Data Visualisation tool to show you the statistics of this year’s Society for Laboratory Automation and Screening (SLAS) conference 2024 held in Boston, MA. Should you attend SLAS? Tradeshows take up a lot of time, money, and resources so you need to...
by Rachel Lively | Jan 24, 2024 | Reports
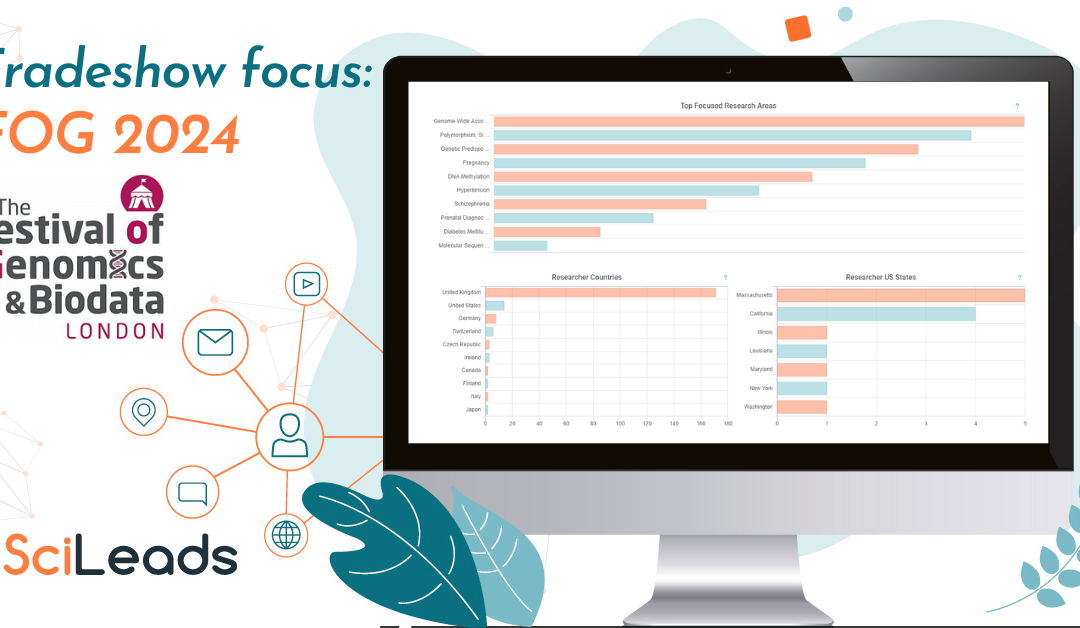
We’ve used our Data Visualisation tool to show you the statistics of this year’s Festival of Genomics and Biodata (FOG) 2024 held in London, UK. Should you attend FOG? Tradeshows take up a lot of time, money, and resources so you need to know whether you will get a...


