by Rachel Lively | Feb 24, 2022 | Reports
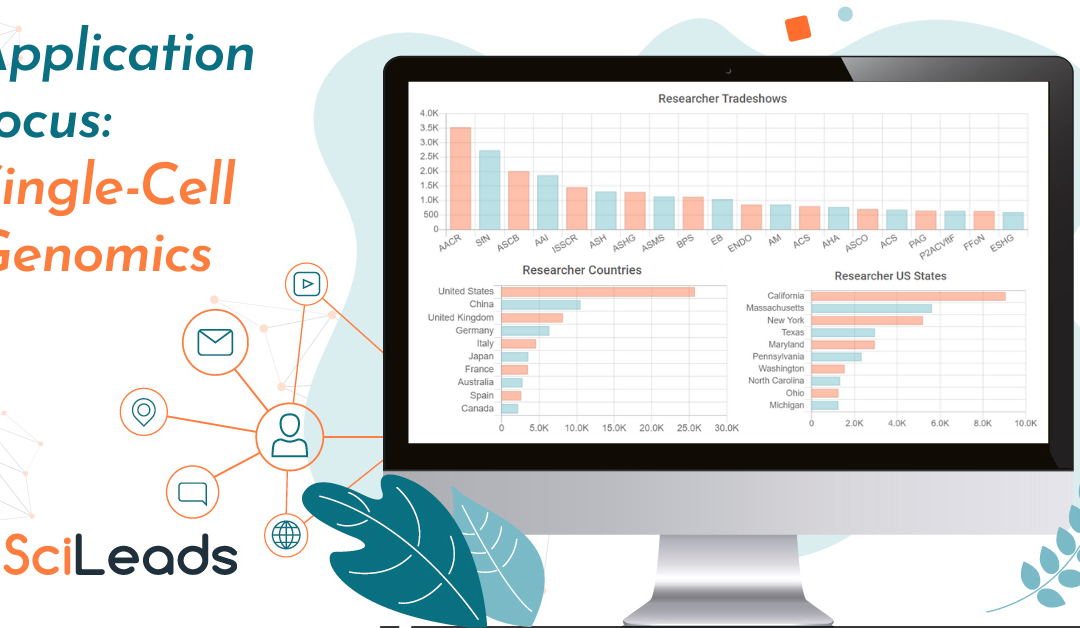
We’ve used our Data Visualisation feature to show the overview of Single-Cell Genomics. This graphical representation of the search results provides you with an accessible way to understand trends, patterns, and outliers from the extensive SciLeads data. In this chart...
by Rachel Lively | Feb 9, 2022 | Reports
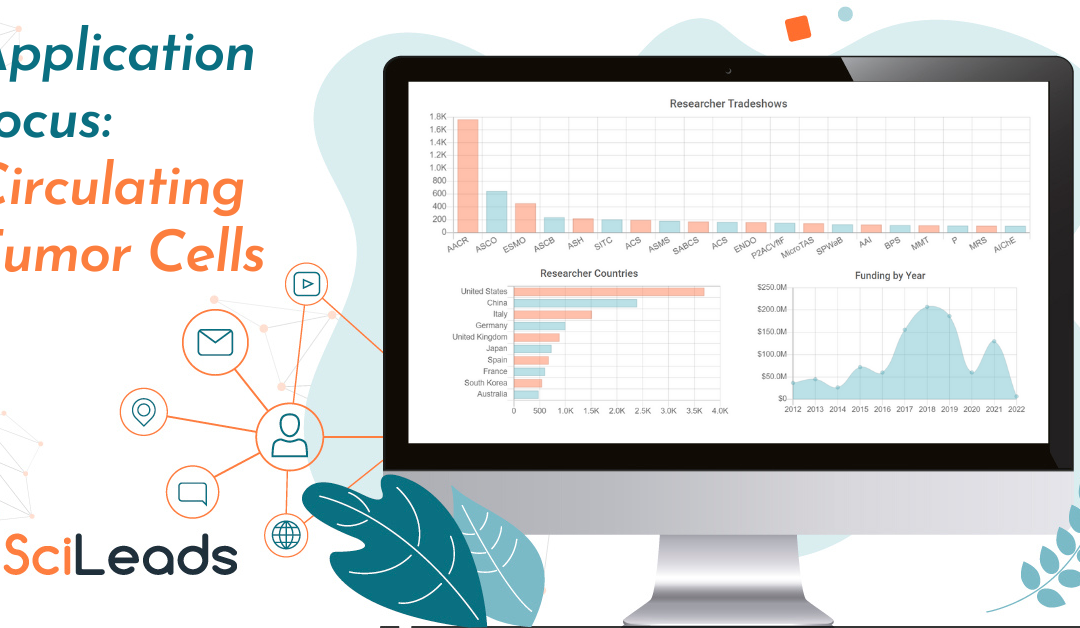
We’ve used our Data Visualisation feature to show the overview of Circulating Tumor Cells (CTCs). This graphical representation of the search results provides you with an accessible way to understand trends, patterns, and outliers from the extensive SciLeads data. In...
by Rachel Lively | Jan 27, 2022 | Reports
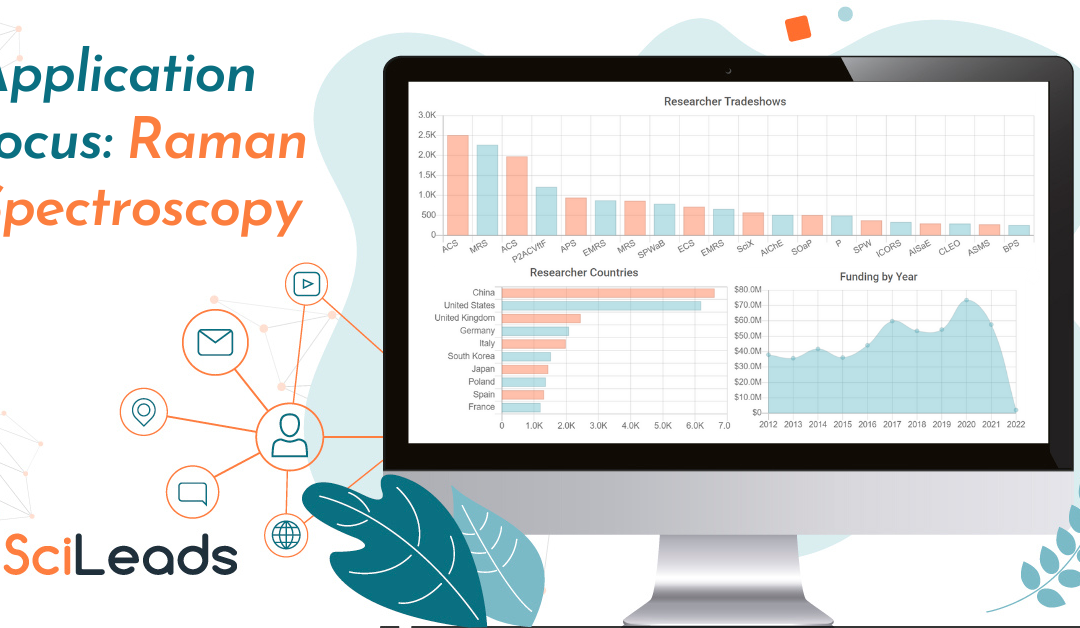
We’ve used our Data Visualisation feature to show the overview of Raman Spectroscopy between 2017-2022. This graphical representation of the search results provides you with an accessible way to understand trends, patterns, and outliers from the extensive SciLeads...
by Rachel Lively | Jan 12, 2022 | Reports
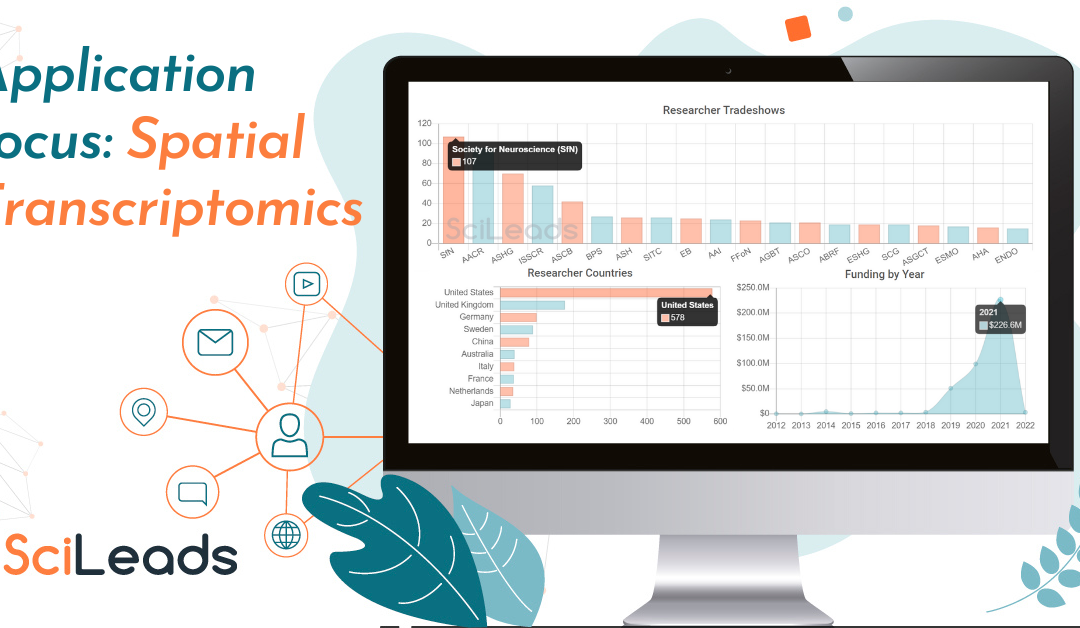
We’ve used our Data Visualisation feature to show the overview of Spatial Transcriptomics between 2017-2022. This graphical representation of the search results provides you with an accessible way to understand trends, patterns, and outliers from the extensive...
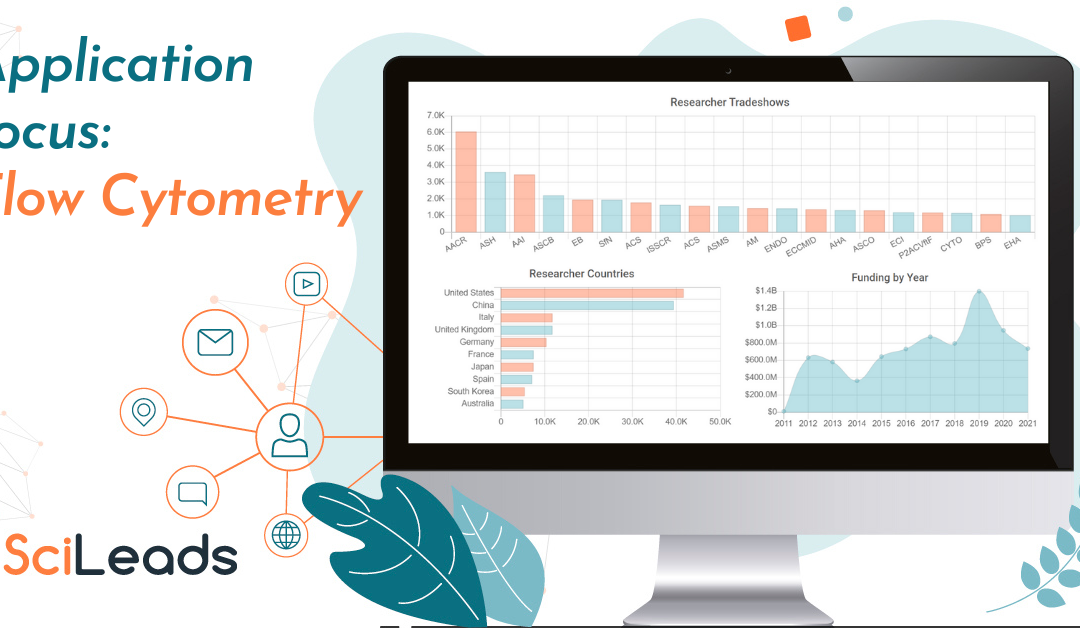
by Rachel Lively | Dec 13, 2021 | Reports
We’ve used our Data Visualisation feature to show the overview of Flow Cytometry between 2017-2021. This graphical representation of the search results provides you with an accessible way to understand trends, patterns, and outliers from the extensive SciLeads data....
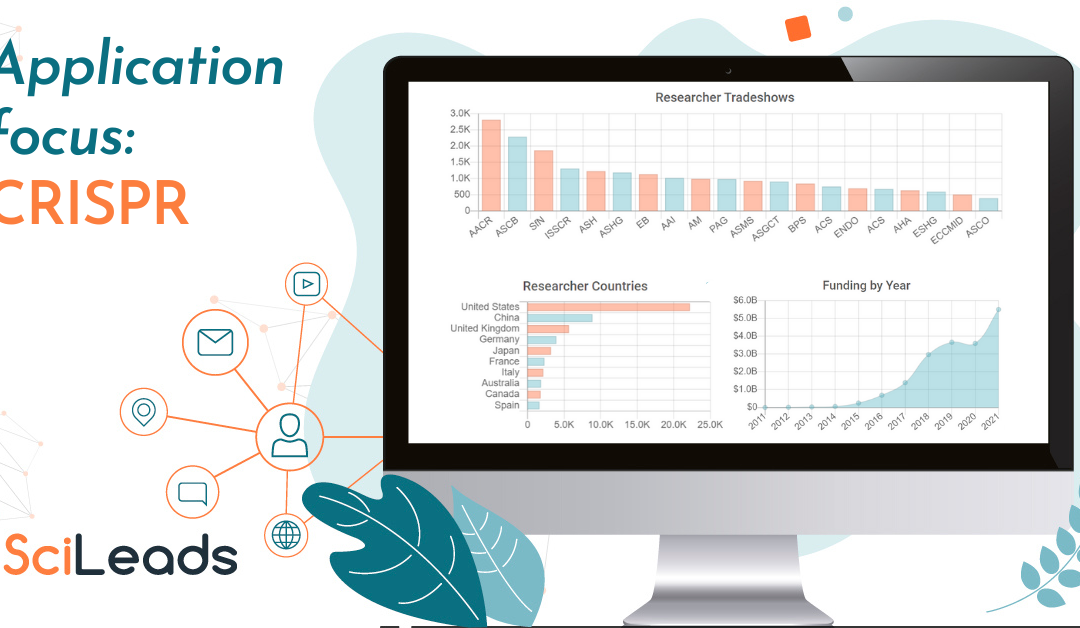
by Rachel Lively | Dec 1, 2021 | Reports
We’ve used our Data Visualisation feature to show the overview of CRISPR between 2017-2021. This graphical representation of the search results provides you with an accessible way to understand trends, patterns, and outliers from the extensive SciLeads data. In this...


