
We’ve used our Data Visualisation feature to show the overview of CRISPR between 2017-2021. This graphical representation of the search results provides you with an accessible way to understand trends, patterns, and outliers from the extensive SciLeads data.
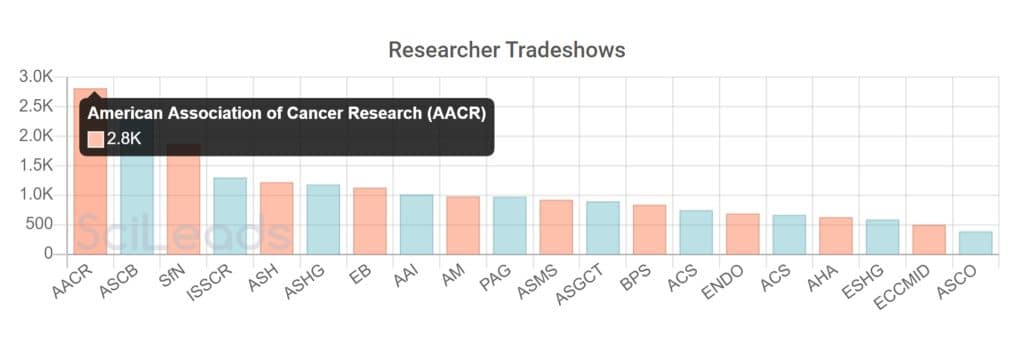
In this chart which details the breakdown of 8.8k trade show posters featuring CRISPR, you can see that the American Association of Cancer Research (AACR) has had 2.8k researchers present a poster featuring this application area.
The Data Visualisation feature provides a high-level overview of the statistics, whereas users can click the ‘Researcher Tab’ to explore the poster talk sessions in more detail.
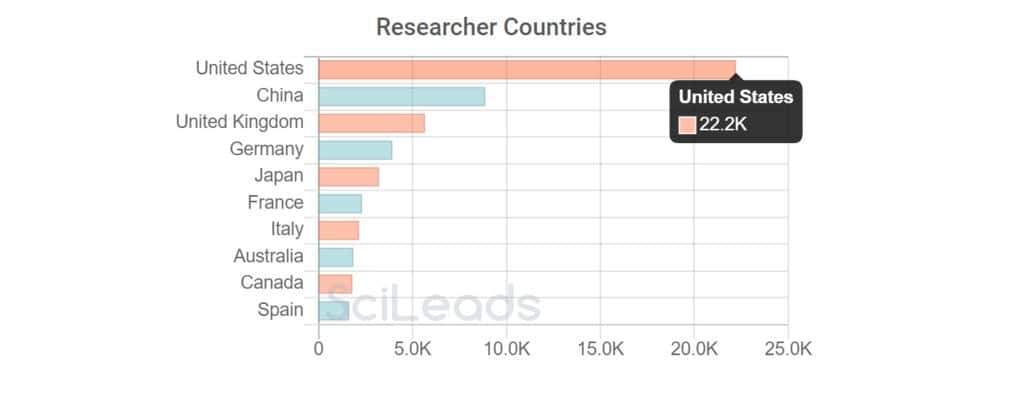
As you can see, the USA has the highest number of researchers for CRISPR by far with a collective result of 22.2k, whereas China, despite being in second place, has less than half that number with 8.9k researchers.
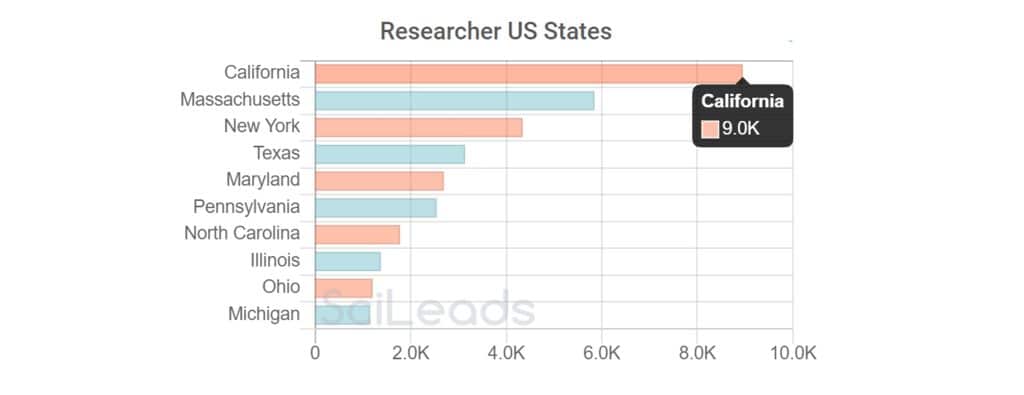
A deep dive into the data shows that the state of California has the most CRISPR researchers with 9.0k.
If you want to run this keyword yourself and get even further insights, get set up with a demonstration and trial here.
Have a data visualization suggestion? If there are other charts and insights you think this feature could show, please send your ideas via our contact us page.
“SciLeads has been critical to the success of our sales and marketing efforts. I don't know where we would be without its data and insights.”