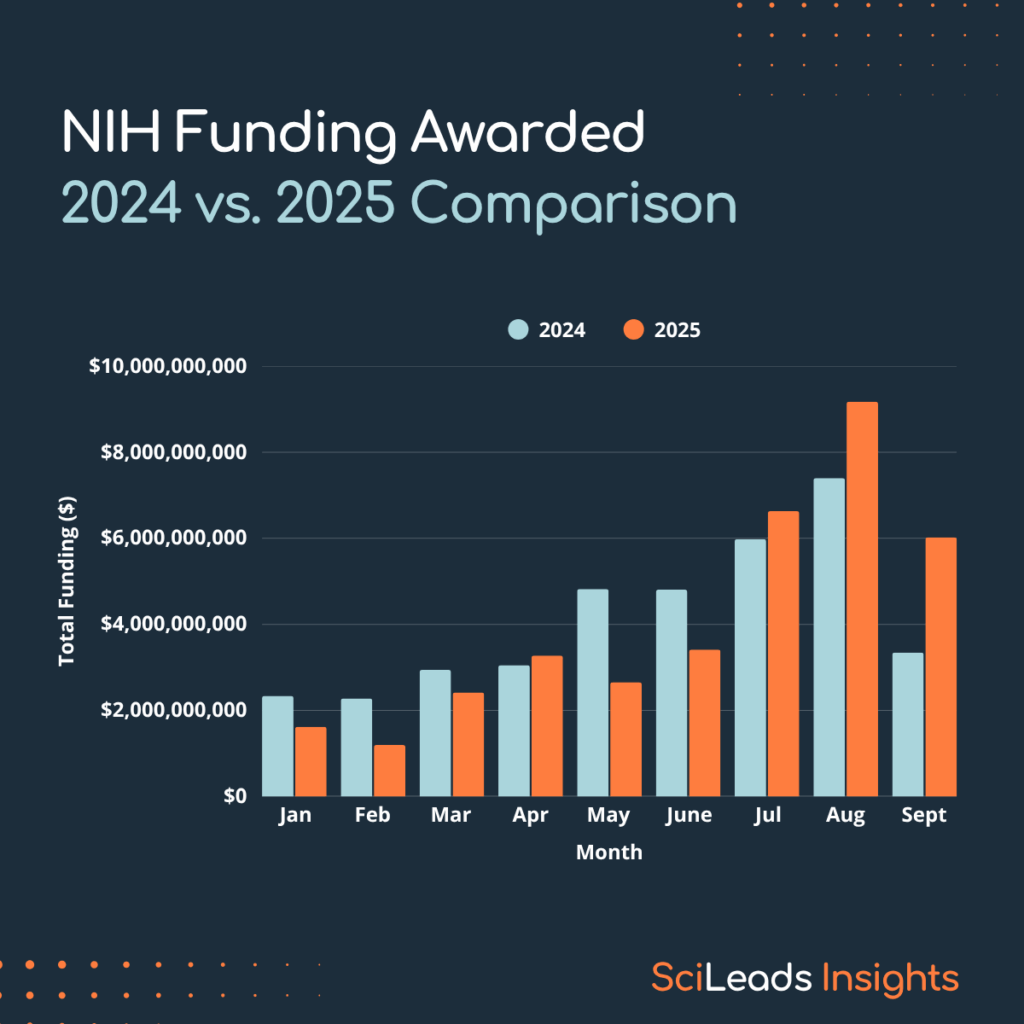
As promised, here are the updated NIH graphs with the September data! Continuing on the trend of the last few months, September was another big month which has clawed back a lot of the deficit from earlier in the year so we’re now only 1.5% behind where we were this time last year! The graphs below show more detail.
Figure 1: NIH Funding by month 2024 versus 2025

2025 lagged behind 2024 for the first 6 months of the year, but September continued the trend of big Q3 results that begin to close that gap. This means for January to September totals, 2025 is only 1.5% behind 2024.
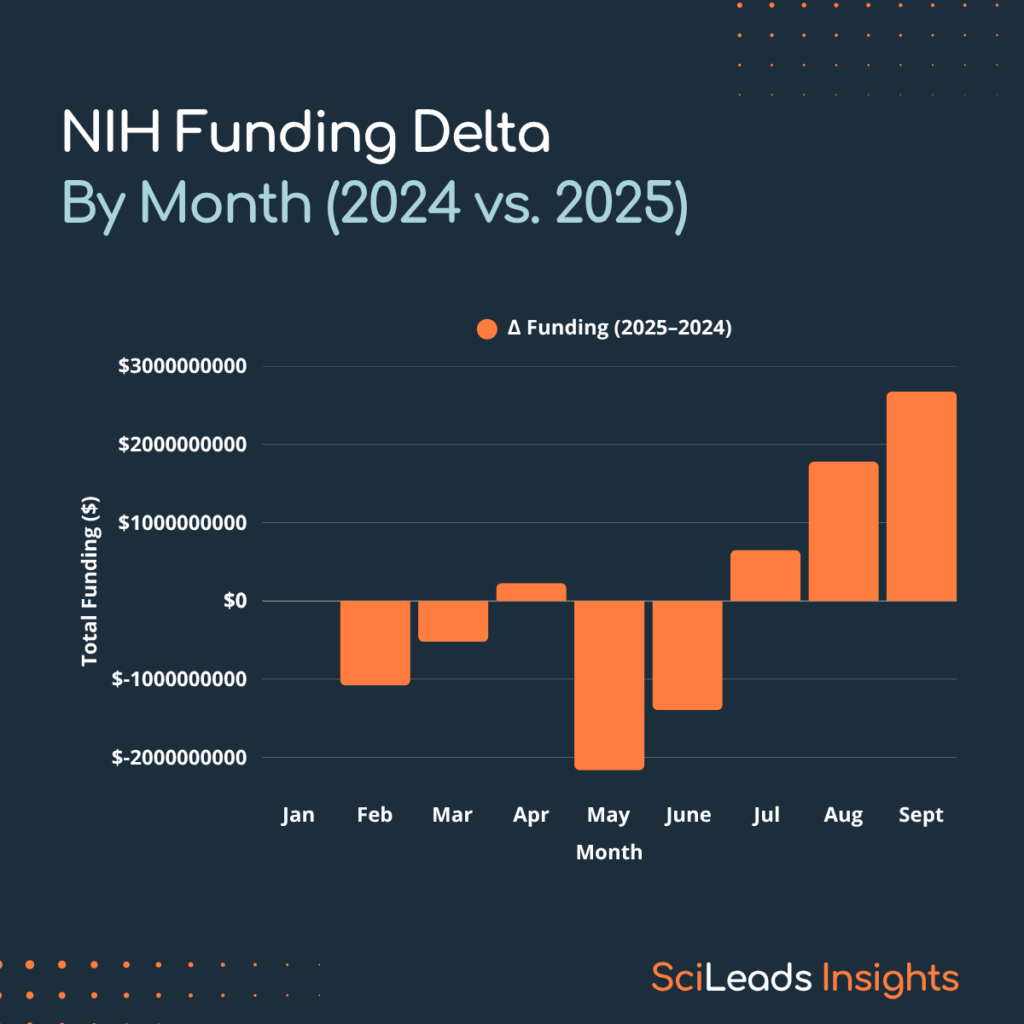
Figure 2: NIH Funding by difference each month between 2024 and 2025

While the rest of the year showed slower progress vs 2024, most of this was recouped in Q3 — with September showing the largest single month difference vs 2024.
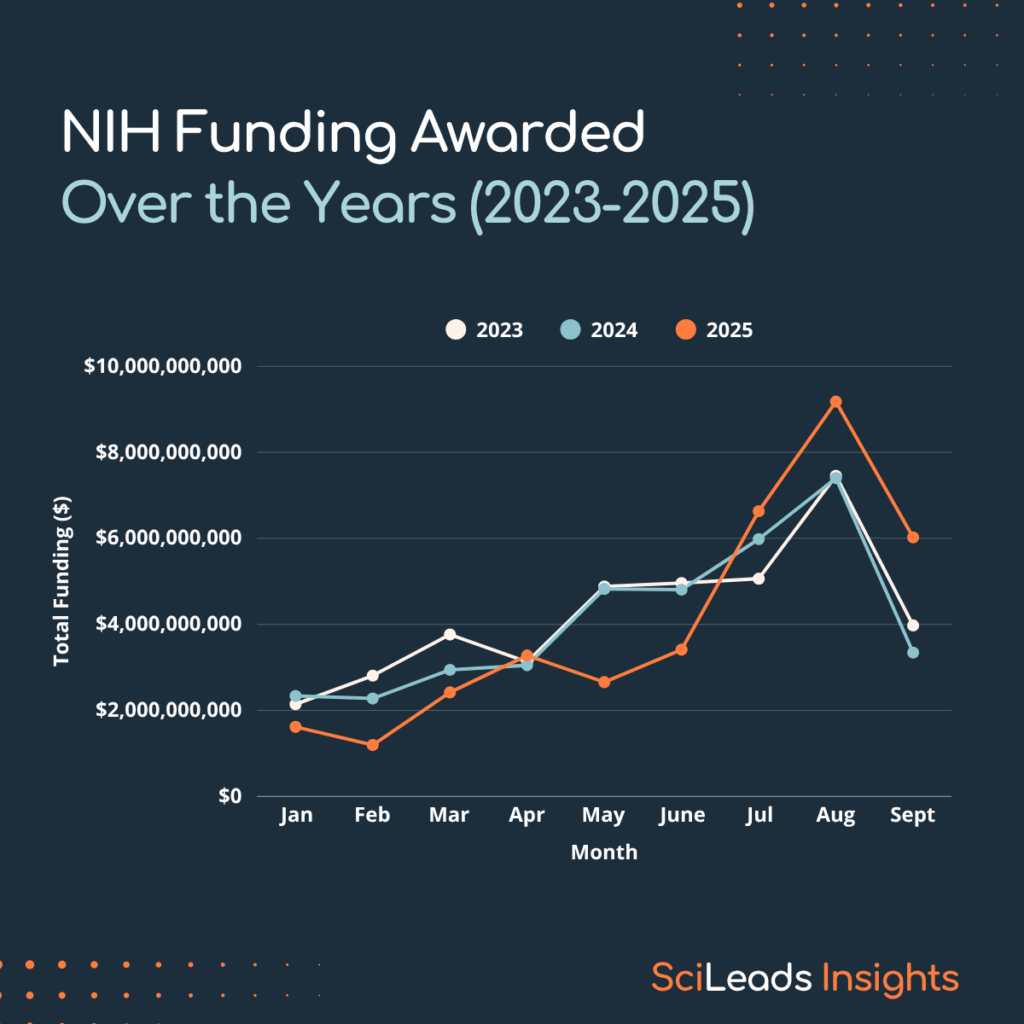
Figure 3: NIH Funding by difference each month between 2023 and 2025

In terms of spread over the year, the past 3 years track pretty similarly.
What can you do about it?
Those of you who had funding alerts set have already taken advantage of this surge in awards. Make sure your SciLeads filters are set to alert you of awarded grants so you can be the first to take advantage of the increase in recent grants, and check out our new Chrome extension, which brings these grant insights directly into your CRM.
We’ll be back with an October update next month 🙂


